C9 - Pivot Tables
FIRST: if you have not reviewed the lesson (or watched the videos) on Pivot Tables, DO SO NOW by going HERE.
Directions Part 1:
- Download THIS file and save to your H: drive
- Using Pivot tables, answer the following questions (you may want to write them down):
- What salesperson sold the most?
- What region sold the most?
- What month had the smallest sales?
- What month had the largest sales?
- How much did Kathy Albertson sell in February?
- Which salesperson sold an average of 670?
- Which salesperson had the lowest sales for January and March together?
- Chris Walter had 9 individual sales. Who had the next highest?
- Who had the lowest sales for March and April combined?
- If you exclude Tia and Chris, what was the total sales for January and March?
- Enter you answers HERE
Directions Part 2:
- Open a blank Excel file and save as "last, first name c9 pivot_tables"
- For each of the charts below, you will use the data file you downloaded in step A and recreate each chart. Take a screencapture of the completed chart and crop everything but the chart. Put each chart on a new tab and rename the tab as "chart 1", "chart 2", etc.
- Turn the finished File into the INBOX.
| Chart 1 |  |
| Chart 2 | 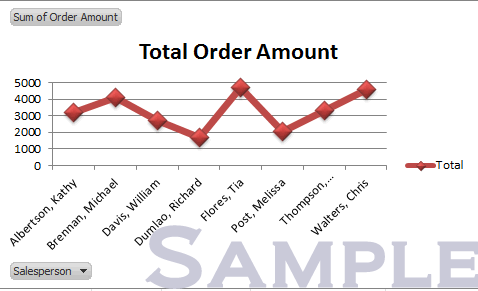 |
| Chart 3 | 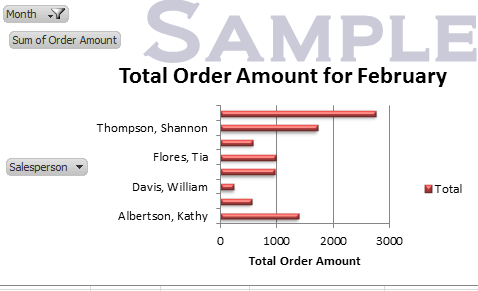 |
| Chart 4 | 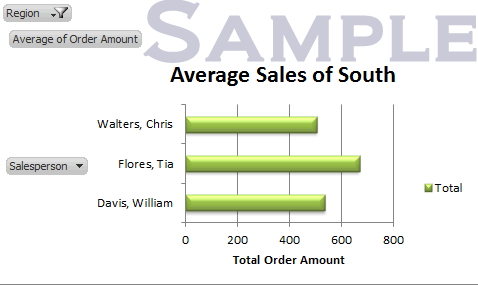 |
| Chart 5 | 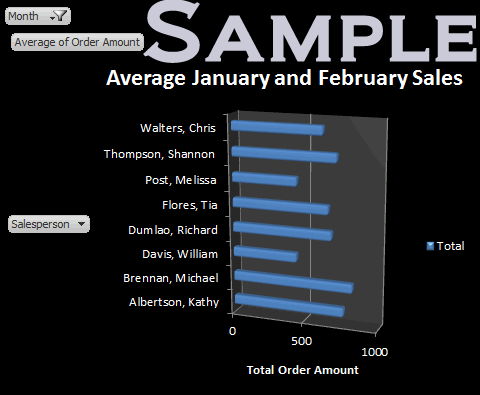 |